


For Week Ending September 29, 2018
The U.S. unemployment rate recently dropped to 3.7 percent, which is its lowest mark since December 1969. The economy continues to bear impressive fruit within and outside of residential real estate, and the Federal Reserve has reacted by raising the benchmark federal funds rate by a quarter of a percentage point, the third rate hike of 2018. While this may be undesirable news for those carrying high credit debt, it is also a reflection of a bright economic outlook.
In the Twin Cities region, for the week ending September 29:
- New Listings increased 15.0% to 1,592
- Pending Sales decreased 6.3% to 1,123
- Inventory decreased 4.7% to 12,653
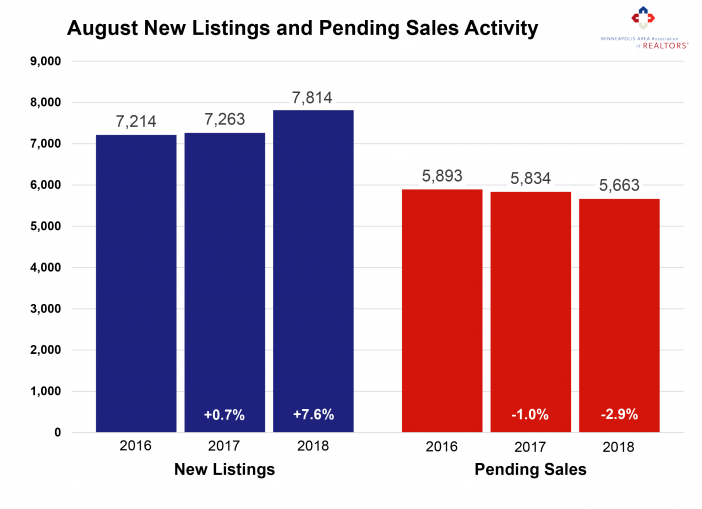
For the month of August:
- Median Sales Price increased 6.3% to $268,000
- Days on Market decreased 16.7% to 40
- Percent of Original List Price Received increased 0.7% to 99.2%
- Months Supply of Inventory remained flat at 2.6
All comparisons are to 2017
Click here for the full Weekly Market Activity Report. From The Skinny Blog.
 Licensed In Minnesota