


 For Week Ending June 18, 2022
The 30-year fixed rate mortgage averaged 5.78% the week ending 6/17, rising 55 basis points from the previous week and marking the largest one week increase since 1987, according to Freddie Mac. Mortgage rates are nearly double compared to this time last year, with rates spiking following the Federal Reserve’s recent decision to raise the benchmark interest rate by three quarters of a percentage point in order to help quash rising inflation.
IN THE TWIN CITIES REGION, FOR THE WEEK ENDING JUNE 18:
- New Listings decreased 14.6% to 1,825
- Pending Sales decreased 11.6% to 1,377
- Inventory increased 7.8% to 7,687
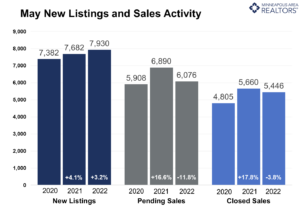
FOR THE MONTH OF MAY:
- Median Sales Price increased 9.0% to $375,000
- Days on Market decreased 4.2% to 23
- Percent of Original List Price Received increased 0.1% to 104.1%
- Months Supply of Homes For Sale increased 27.3% to 1.4
All comparisons are to 2021
Click here for the full Weekly Market Activity Report. From MAAR Market Data News.
 Licensed In Minnesota