


Home price growth has slowed and now more closely matches income and wage growth – a healthy development.
- « Previous Page
- 1
- …
- 46
- 47
- 48
- 49
- 50
- …
- 57
- Next Page »
Weekly Market Report
 For Week Ending August 17, 2019
As families across the U.S. enjoy the last few weeks of summer before the start of the school year, it seems that the real estate market is seeing an infusion of new energy that is partially offsetting the expected seasonal slowdown. Further decreases in housing inventory and month’s supply at the national level point to a moderate influx of new buyers, perhaps due to the allure of lower mortgage rates. It remains to be seen whether these trends will be affected by events in the general economy.
In the Twin Cities region, for the week ending August 17:
- New Listings decreased 2.9% to 1,712
- Pending Sales increased 3.9% to 1,316
- Inventory decreased 3.5% to 12,392
For the month of July:
- Median Sales Price increased 5.9% to $283,900
- Days on Market remained flat at 38
- Percent of Original List Price Received decreased 0.1% to 99.7%
- Months Supply of Homes For Sale remained flat at 2.5
All comparisons are to 2018
Click here for the full Weekly Market Activity Report. From MAAR Market Data News.
Inventory and Interest Rates Likely Driving Sales Growth
August 19, 2019
The current economic expansion recently became the longest on record, but it’s showing its age. Concerns around slowing growth have spiked amidst new economic data and gyrations in equity markets, but it’s also created opportunities for home buyers. The upside is that mortgage rates have fallen yet again as investors flock to the safety of longer-term U.S. government bonds, thereby driving down the 10-year treasury yield and the 30-year mortgage rates that follow it. That means markets expect monetary easing and lower interest rates to spur growth in the short-term. The risk of recession has grown, but the economy is still buzzing along at a decent pace. Buying a home is an emotional decision, and buyers sometimes pull back at any whiff of turbulence out of fear of hardship.
Twin Cities home buyers and sellers, however, did not pull back in July. Sales rose 4.5 percent and sellers even listed almost 2.0 percent more product than last July. Despite lower interest rates and modest inventory gains as tailwinds, the persistent shortage of homes on the market and affordability headwinds remain. Price increases and wage gains are more aligned now than in the past, but investors are still competing with millennial first-time buyers in the already competitive under $300,000 segment. Conversely, there’s some evidence of a slow-down in the luxury segment. Metrics to watch aside from sales and prices include market times, the ratio of sold to list price and months of supply. These three indicators could be hinting at potential market shifts ahead. That said, home price declines are unlikely until absorption rates rise above 6 months. We’re currently at 2.4 months.
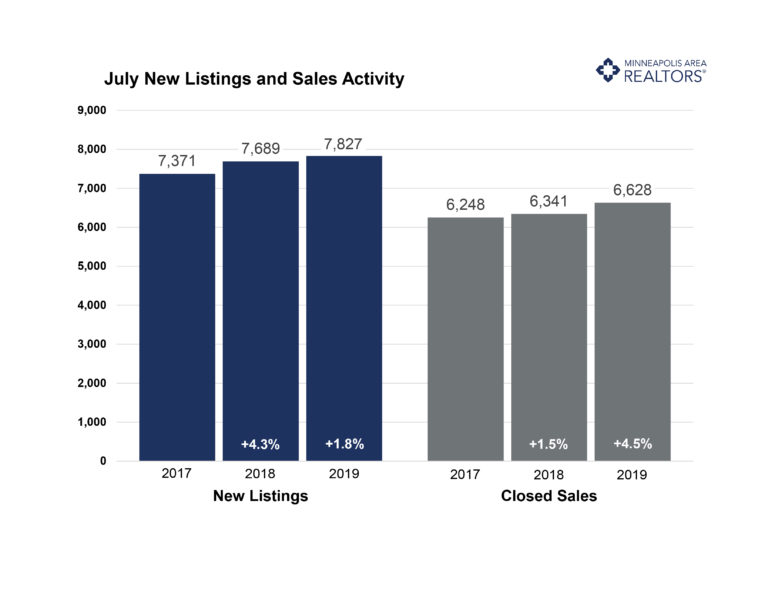
July 2019 by the Numbers (compared to a year ago)
- Sellers listed 7,827 properties on the market, a 1.8 percent increase from last July
- Buyers closed on 6,628 homes, a 4.5 percent increase
- Inventory levels decreased 4.4 percent from last July to 11,961 units
- Months Supply of Inventory was down 4.0 percent to4 months
- The Median Sales Price rose 5.9 percent to $283,700, a record high for July
- Cumulative Days on Market remained stable at 38 days, on average (median of 18)
- Changes in Sales activity varied by market segment
-
- Single family sales rallied 6.0 percent; condo sales increased 2.2 percent; townhome sales rose 0.8 percent
- Traditional sales increased 5.6 percent; foreclosure sales dropped 17.6 percent; short sales fell 37.5 percent
- Previously owned sales were up 5.6 percent; new construction sales rose 4.5 percent
Quotables
“There are lots of headlines out there vying for our attention,” said Todd Urbanski, President of Minneapolis Area REALTORS®. “The bottom line is that the best time to buy a home is when you’re ready. Over 70.0 percent of Minnesotans have made that choice, the vast majority of whom have seen their values increase.”
“No one thought mortgage rates would touch 3.6 percent again,” said Linda Rogers, President-Elect of Minneapolis Area REALTORS®. “Buyers who felt squeezed by a monthly mortgage payment should take another look and consider this a fleeting gift.”
From The Skinny Blog.
Weekly Market Report
For Week Ending August 10, 2019
As July data roll in, more economists wonder whether we are seeing the signs of an economic slowdown. Yet that would not necessarily imply a slowdown in the housing market. While July’s existing home sales fell below analyst expectations, consumer confidence in housing reached new highs as mortgage rates dropped and more homeowners refinanced their homes. It remains to be seen whether growing confidence and lower rates will help boost home sales.
In the Twin Cities region, for the week ending August 10:
- New Listings decreased 2.1% to 1,794
- Pending Sales increased 3.8% to 1,342
- Inventory decreased 3.0% to 12,339
For the month of July:
- Median Sales Price increased 6.0% to $283,950
- Days on Market remained flat at 38
- Percent of Original List Price Received decreased 0.2% to 99.6%
- Months Supply of Homes For Sale remained flat at 2.5
All comparisons are to 2018
Click here for the full Weekly Market Activity Report. From MAAR Market Data News.
Weekly Market Report
For Week Ending August 3, 2019
While financial markets are becoming more volatile in recent weeks, national and regional real estate indicators are sending mixed signals. For the first time in seventeen months, July pending sales saw moderate gains over the previous year nationally. At the same time, home prices continue to be at or near record levels in many markets as supply remains limited.
In the Twin Cities region, for the week ending August 3:
- New Listings increased 7.1% to 1,984
- Pending Sales decreased 1.0% to 1,341
- Inventory decreased 3.8% to 12,152
For the month of June:
- Median Sales Price increased 7.2% to $290,000
- Days on Market increased 2.5% to 41
- Percent of Original List Price Received decreased 0.3% to 100.0%
- Months Supply of Homes For Sale increased 4.0% to 2.6
All comparisons are to 2018
Click here for the full Weekly Market Activity Report. From MAAR Market Data News.
Weekly Market Report
For Week Ending July 27, 2019
As we await July results, the June numbers and preliminary July indicators suggest that current trends in most real estate markets are likely to continue. Mid-to-lower priced segments continue to experience imbalances favoring sellers, leading to steady year-over-year increases in price, outpacing inflation in many markets. Although the Fed rate decrease dominated the news this week, industry experts seem to agree this event by itself is unlikely to have much effect on mortgage rates and real estate markets, at least in the short term.
In the Twin Cities region, for the week ending July 27:
- New Listings decreased 4.7% to 1,736
- Pending Sales decreased 4.9% to 1,364
- Inventory decreased 3.0% to 12,236
For the month of June:
- Median Sales Price increased 7.2% to $290,000
- Days on Market increased 2.5% to 41
- Percent of Original List Price Received decreased 0.3% to 100.0%
- Months Supply of Homes For Sale increased 4.0% to 2.6
All comparisons are to 2018
Click here for the full Weekly Market Activity Report. From MAAR Market Data News.
June Monthly Skinny Video
Despite strong buyer demand, sales totals are lower due to a lack of affordable supply
Weekly Market Report
For Week Ending July 20, 2019
Residential real estate markets across the nation have been performing quite well at this point in the year in terms of home sales, price and inventory. Although not always true at every price point and home type in every geography, the general rule of thumb in 2019 as we stretch beyond the halfway point of the year has been a trend of relative market balance, which is a great thing for both real estate professionals and consumers.
In the Twin Cities region, for the week ending July 20:
- New Listings decreased 2.4% to 1,883
- Pending Sales decreased 3.6% to 1,342
- Inventory decreased 2.8% to 12,005
For the month of June:
- Median Sales Price increased 7.2% to $290,000
- Days on Market increased 2.5% to 41
- Percent of Original List Price Received decreased 0.3% to 100.0%
- Months Supply of Homes For Sale increased 4.0% to 2.6
All comparisons are to 2018
Click here for the full Weekly Market Activity Report. From MAAR Market Data News.
Weekly Market Report
For Week Ending July 13, 2019
Every year during the week of Independence Day, real estate markets across the country slow down as buyers, sellers and real estate professionals take some time off during the height of summer to spend time with friends and family. This year continued that tradition, except that new listings declined a little more and pending sales rose a little more. This is of particular interest because that is the exact dynamic that will keep prices on the rise.
In the Twin Cities region, for the week ending July 13:
- New Listings increased 0.5% to 2,227
- Pending Sales increased 0.3% to 1,470
- Inventory decreased 2.1% to 11,759
For the month of June:
- Median Sales Price increased 7.2% to $290,000
- Days on Market increased 2.5% to 41
- Percent of Original List Price Received decreased 0.3% to 100.0%
- Months Supply of Homes For Sale remained flat at 2.5
All comparisons are to 2018
Click here for the full Weekly Market Activity Report. From MAAR Market Data News.
Some mixed signals but market fundamentals remain intact
July 18, 2019
In the face of mixed signals, assessing market health can be a challenge. The economy remains healthy, mortgage rates are outrageously low and yet sales aren’t rising. That’s in part because we simply haven’t built enough homes to keep pace with the demand. Despite attractive mortgage rates, the supply of available homes is so tight that sales are struggling to keep pace. Rising home prices typically incentivize more sellers to list. But with nowhere to go because of the shortage, listing activity is down. New construction has been hampered by rising land, labor and material prices as well as regulation, forcing builders to create new supply in the high-end luxury market often at the expense of more affordable entry-level product. But the demand from millennials (and some baby boomers) is concentrated in the affordable price points, creating multiple-offers and frustrated buyers.
But it’s that tight inventory that’s still driving prices higher. Sales prices reached a new all-time high of $290,000 in June—likely our high for the year. New listings stumbled 3.1 percent while pending sales were down 2.9 percent. Days on market remained flat compared to June 2018 while the ratio of sold to list price fell for a fifth consecutive month. In some ways, the market is improving for buyers, even though sellers are still enjoying strong pricing power, favorable negotiating leverage and quick market times. For the last nine months, buyers have seen more active listings for sale than the year prior. We still have a tale of two markets: strong demand, weak supply and price growth in the affordable brackets compared to a slight oversupply, slow market times and weaker pricing in the upper brackets.
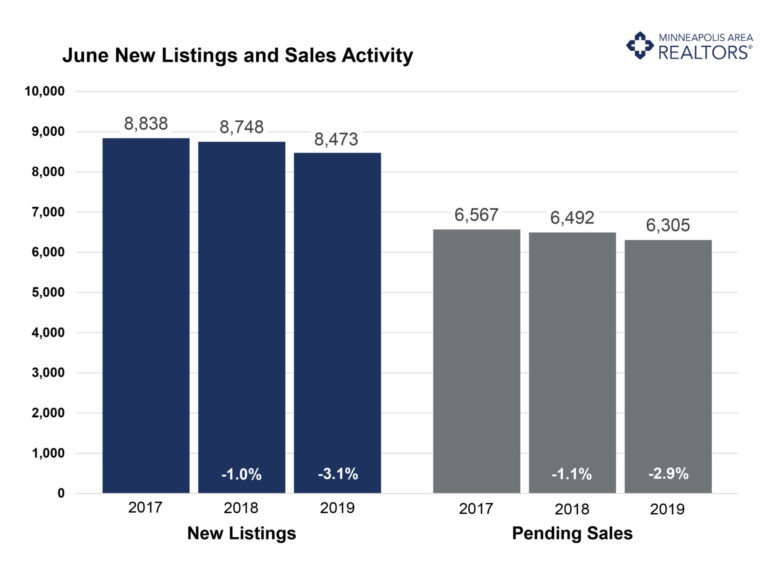
June 2019 by the Numbers (compared to a year ago)
- Sellers listed 8,473 properties on the market, a 3.1 percent decrease from last June
- Buyers closed on 6,604 homes, an 8.2 percent decline
- Inventory levels decreased 1.3 percent from last June to 12,063 units
- Months Supply of Inventory was flat at5 months
- The Median Sales Price rose 7.2 percent to $290,000, a record high for any month
- Cumulative Days on Market remained stable at 40 days, on average (median of 16)
- Changes in Sales activity varied by market segment
- Single family sales fell 7.5 percent; condo sales fell 13.3 percent; townhome sales decreased 6.1 percent
- Traditional sales declined 6.8 percent; foreclosure sales dropped 46.4 percent; short sales fell 48.1 percent
- Previously owned sales were down 8.1 percent; new construction sales rose 2.0 percent
Quotables
“The market is quiet right now, not every month shows significant change. Inventory is low, buyer demand is still evident and interest rates are phenomenal,” said Todd Urbanski, President of Minneapolis Area REALTORS®. “The untold story is the increase in net worth for homeowners. Rising prices mean rising equity. It can be a challenge to find a home, but homeownership is the best avenue to wealth-building.”
“The idea of the ‘housing market’ as a singular entity can be misleading,” said Linda Rogers, President-Elect of Minneapolis Area REALTORS®. “Cities, neighborhoods and different segments can often show tremendous variation.”
From The Skinny Blog.
- « Previous Page
- 1
- …
- 46
- 47
- 48
- 49
- 50
- …
- 57
- Next Page »
 Licensed In Minnesota